Home Science Page Data Stream Momentum Directionals Root Beings The Experiment
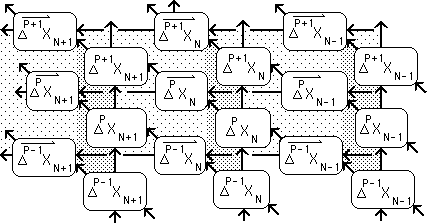
In previous notebooks, we have only looked at a context-based approach to the derivatives. Each of the derivatives has been defined in terms of other derivatives in the vicinity. Below is a diagram illustrating the interlocking connections. Each of the arrows represents a very simple operation, i.e. addition, subtraction, multiplication or division by a constant factor. There are two interacting planes: the Directional Plane in back and the Plane of the Change Series in front. The two layers feed each other back and forth.
Notice that the Raw Data is not referred to at all. To derive the Pth Derivative of the Nth Data Point, one only need know two of the surrounding derivatives. The Raw Data has been refined down to essences of derivatives. Notice that each cell has two and only two arrows feeding into it. The context-based approach is simple, if the context is well defined.
But what happened to the data? Below is a conversion of the above diagram. It returns to the beginning, when P and N are both equal to zero.

Remembering that the zeroth level of change is the raw Data itself and that the zeroth Deviation is the Decaying Average, we convert the diagram to a more familiar form.

Remembering that X0 = 0 in a Continuous Data Stream, we convert all of the appropriate cells to zero. We find, as we did before, that the zeroth point in any of the Change Series equals zero, because they are only fed by X0. Consequently we also find that the zeroth point of any of the Derivative Series also equals zero because they are only fed by the zeroth point of the Change Series. This corresponds with previous results.

Finally we eliminate the cells before X1 because they all equal zero, leaving us with the Diagram below. The Raw Data is independent of anything else. The Raw Data feeds the first level of the Change Series and zeroth level of the Directional Series, the Decaying Average. After the first point, each cell of both the Change Series and the Directional Series is fed both by an adjacent cell from the Change layer and by an adjacent cell from the Directional layer. This process continues indefinitely in both directions.

It is easy to calculate any of the cells, provided one knows the value of the adjacent cells of both layers. For the cave man this is easy because his genetics have provided him with context-based neural networks, which store the most relevant information. The raw data is immediately converted to derivative form. Additionally only the most recent averages are stored, (along with extreme data, of course.) But since we are scientists using our brains and computers, we don't have the luxury of such imprecision. For one we can't pull these averages from our consciousness. These averages are stored subliminally. All of us can make quick and precise predictions when a ball is tossed toward us, to catch or avoid it. But we can't put a finger on the data or process that our brain and its derivatives went through to make the decisions. Let us investigate the relation between the Raw Data and the Higher Derivatives, independent of the intermediate Derivatives, to have a better understanding of the processes involved. We are shifting from this context-based approach to a content-based approach.
Dead Data Streams are predictable. Hence once the starting point and the function are known, all else follows. This is a major concept of the physical sciences. Because of the spectacular success of science, whole religious philosophies have been founded upon it. The reasoning of the religious man goes that if scientists can predict with such accuracy the revolution of the planets many millennia in advance, then surely God who is superior to man can know everything that will ever happen before it ever happens. The Calvinists were the ultimate manifestation of this philosophy with their idea of predestination. This philosophical idea still is at the basis of the beliefs of many scientifically religious people in the West. Instead of predestination, they call it the Big Bang. The enlightened modern man of science believe that if scientists knew all of God's functions, and if they also knew the starting densities of the initial Singularity before the Big Bang and had a computer that was big and fast enough, then that they could predict this Notebook and me writing it right now.
The idea is that God is the ultimate manifestation of the Scientist or Mathematician. He has all the equations. He has all the starting points. And he is a powerful enough computer that he can predict everything well in advance. They have eliminated spontaneity as a characteristic of the Godhead. Many scientists echo Laplace's statement that God is an unnecessary postulate in his understanding of the Universe. God becomes the Great Starting Point, who bows out after the great Unfurling begins. After the 6th day of work, God began the Big Rest, which lasts the rest of Eternity.
We take a different tack. In this series of Notebooks we are studying Live Data Streams, which are inherently unpredictable by definition. If science reflects belief, then an underlying religious assumption beyond these equations, words, graphs and diagrams, is that God is unpredictable, active, and alive; unbound by function or form. This does not preclude study or knowledge, as these volumes attest to. We are throwing off the bonds of Predictability. But, of course that's a little scary. So these words are not meant for just anyone. They are only meant for those who are willing to face the Void senselessly, with the proper Respect and Awe.
The above contextual diagrams are meaningless in the physical sciences. For one, the only piece of Data that matters to the physical sciences is the first one. All the rest are inconsequential, because they follow from the first. Our last Diagram would collapse immediately to the first two columns only, the first piece of Data and its derivatives. These differential equations preclude any need to know any more information than is provided by the first columns. All else is predictable. The main emphasis of physical science for the last few centuries has been to determine the meaning of the arrows between the first data point and the subsequent derivatives. They have discovered some marvelous functions, which successfully predict many wondrous things. These incredible functions have led to a technological revolution in our lifetimes.
However if a function can successfully describe a Data Stream then it is a Dead Data Stream and we are only studying Live Data Streams. We are starting with the assumption that Live Data Streams exist. Although Live Data Streams are, by nature, by definition, unpredictable, they still have identifiable characteristics. Hence the above diagrams make sense in this context only. In the context of physical science they are meaningless. The only thing that matters to the physical scientist is determining the nature of the arrows between cells. In this study our arrows are simple and straightforward operations that an elementary school student could perform and understand. But because the Data Streams are unpredictable, these elementary computations become quite complex, as we shall see. But enough philosophizing, let us move on to the heart of this Notebook, a content-based approach to the Data Stream Derivatives.